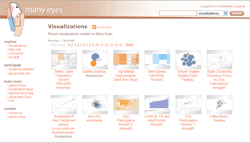
 A few weeks ago I blogged about Swivel, a cool place for kids to play with data and comment on others datasets and visualisations. Today Geoffrey blogged about an IBM Alphaworks site that takes this concept in a different direction.
At Many Eyes, the emphasis is on exploring visualisations and the ease with which you can take a dataset and try on a few different ways of presenting the data. You upload a dataset simply by copying the data from Excel and pasting it into a dialogue on their site. The page then gives you a view of your data to confirm that the engine has chosen the appropriate data types for your data columns and you are good to go. You can quickly and painlessly click on a type of chart and your results are almost instantly visible. Popup menus let you tweak with the display and when you are comfortable with the results you provide a title and description and others can then witness your handiwork. Of note is that there are transition effects when you alter aspects of your visualization. The charts do not simply redraw…they ‘magically’ evolve to your requests. This is superb attention to detail.
You can now even embed the result into your blog:

With datasets and visualisations uploaded and generated users are invited to comment on these much like Swivel. There doesn’t seem to be an enormous number of comments on the IBM site relative to Swivel. I sense that swivel is directed more towards those that have a specific problem they are wrestling with and are familiar with the swivel community. The IBM site is probably slicker technologically and offers a wider collection of the latest visualisation trends, more individually focussed towards giving you the opportunity to try out some new techniques to satisfy your own needs. Both sites are slick in general. I am going to have to play with this IBM one some more.
It raises a big question for me and that is: Do we actually live in a numerate society? I am not sure I consider myself numerate at times and wonder whether people think numerically in general. Moreover, do most people really care about the statistical nuances that we are trying to play with here? Well, sites like this will certainly begin to answer these questions.
If you like a good tutorial, try the video provided by Jonathan Feinberg. Well done.

[…] work bringing us new means of visualizing datasets and providing a social network for dataheads. My earlier article I spoke glowingly of the attention to detail that the site exhibited and wealth of charting […]